

Flew for a while and the aircraft just vibrates. Adjusted the PID — still vibrates. What is the actual problem?
The answer isn’t in the sky, it’s in the logs.
ArduPilot flight controllers automatically record DataFlash logs on every flight, containing dozens of parameters: raw gyroscope data, PID outputs, motor commands, vibration levels, and more. Learning to read logs is like giving your flight controller a full physical examination. In this article, I use real flight logs from three different aircraft — an F450 DIY build, a MARK5 racing drone, and a 3D-printed micro-UAV — to walk you through log analysis from scratch.
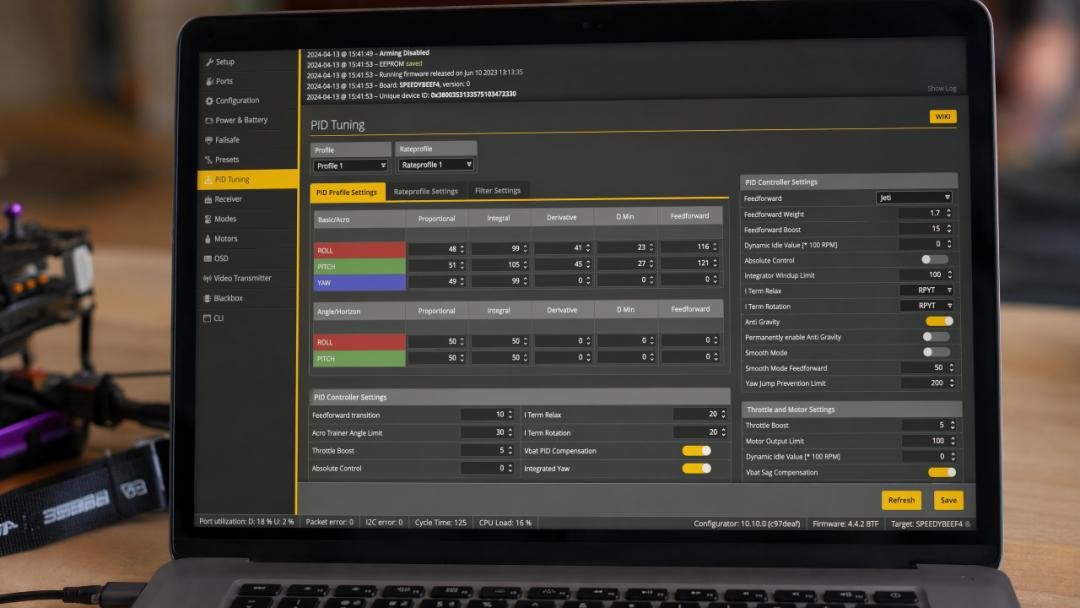
Where DataFlash Logs Are Stored and How to Read Them
-
Storage location: DataFlash logs are stored on the flight controller’s onboard microSD card. On Pixhawk-series controllers, inserting the card creates an automatic log folder at
/APM/LOGS/. Each arm-and-fly session generates one.binformat log file. -
How to read them: Connect the flight controller to a PC via USB, open Mission Planner, go to the “Flight Data” page, click the “DataFlash Logs” tab, and select “Download DataFlash Log via Mavlink” to save logs locally. You can also pull the SD card and use a card reader.
-
Analysis tools: Mission Planner has a built-in log analyzer — after downloading logs, click “Auto Analysis” to automatically detect common issues. But auto-analysis only catches surface-level problems; deep causes require manually inspecting specific charts.
-
I recommend also installing ArduPilot Log Analyzer (APM Log Analyzer), which provides finer-grained vibration spectrum and PID response curve viewing.
Three Key Data Channels: Read These Three Curves First
After opening a log, there are dozens of data channels — don’t panic. To locate PID oscillation issues, start with these three groups:
1. GYRO — Raw Gyroscope Data
-
Path:
GYRO[0].AccX/GYRO[0].AccY/GYRO[0].AccZ(or Roll/Pitch/Yaw) -
This is the gyroscope’s unfiltered raw angular rate data. If this curve shows high-frequency jitter during flight, it indicates a physical vibration source — possibly unbalanced propellers, worn motor bearings, or frame resonance.
-
Threshold: The gyroscope raw data standard deviation should be less than 3 rad/s during hover. If it exceeds 5 rad/s, vibration is severe and physical vibration reduction must be done before PID tuning.
-
My F450 (2212 920KV motors + 1045 propellers + 3S 5200mAh battery) as an example: GYRO.Roll standard deviation was 7.2 rad/s before propeller dynamic balance correction, and dropped to 2.1 rad/s after. The difference is enormous.
2. PID — Controller Output
-
Path:
PIDR.P/PIDR.I/PIDR.D(Roll axis),PIDP.(Pitch axis),PIDY.(Yaw axis) -
This is the actual output value of the flight controller’s PID controller. If the P value oscillates violently during flight, the controller is fighting hard to correct — usually because the P value is too high causing oscillation, or there is sustained external disturbance.
-
Threshold: The P value should change smoothly during hover, with amplitude within ±0.1. If the P value frequently shows peaks above ±0.3, the controller is oscillating.
3. CTUN — Throttle and Altitude
-
Path:
CTUN.ThO(throttle output),CTUN.BarAlt(barometer altitude) -
The throttle curve reflects whether motor response is consistent. If the throttle curve shows periodic fluctuation during hover, one motor may be responding inconsistently, or the PID parameters are mismatched.
Practical Case Studies: Log Comparison Across Three Aircraft
Case 1: F450 DIY Build — Classic Multirotor Oscillation
-
Config: F450 frame (450mm wheelbase), 2212 920KV motors, 1045 propellers, 30A BLHeli ESCs, Pixhawk 4 flight controller, ArduPilot 4.6.3 firmware.
-
Symptoms: Slight left-right shaking during hover; nose pitching up and down during forward flight.
-
Log analysis: Opened the GYRO.Roll curve — hover segment standard deviation was 4.8 rad/s, which is high. Checked the PIDR.P curve; P value oscillated between ±0.25 and ±0.35 at about 5-6 Hz frequency.
This is classic P-value-too-high oscillation. The F450 recommended starting value is ATC_RAT_RLL_P=0.135, but my logs showed the actual oscillation frequency was 5 Hz, corresponding to a propeller rotation speed of ~5400 RPM (90 Hz) — not a propeller frequency resonance issue.
-
Solution: Reduced ATC_RAT_RLL_P from 0.135 to 0.110; synchronized reduction of ATC_RAT_PIT_P. After adjustment and a re-flight, GYRO.Roll standard deviation dropped to 2.3 rad/s and PIDR.P oscillation amplitude reduced to ±0.12.
Case 2: MARK5 Racing Drone — High-Frequency Resonance
-
Config: MARK5 5-inch carbon fiber frame, 2207 1750KV motors, 5045 propellers, BLHeli32 50A ESCs, Radiolink F405 flight controller, INAV 8.0.0 firmware, 6S 1300mAh 120C battery.
-
Symptoms: Severe jelly effect on the camera feed at full throttle; normal hovering at low/mid throttle.
-
Log analysis: This is a classic throttle-related vibration pattern. In INAV logs, the GYRO.Roll curve showed a standard deviation of 1.5 rad/s below 50% throttle and a spike to 12 rad/s above 80% throttle.
Vibration that worsens with throttle increase is 90% likely to be frame resonance — the MARK5’s carbon fiber frame arms resonate at specific motor RPM. FFT spectrum analysis showed a resonance peak concentrated around 350 Hz.
-
Solution: Set a Dynamic Notch filter in INAV, with the center frequency auto-tracking the 350 Hz resonance peak and Q value set to 250. After enabling it, high-frequency vibration was attenuated by over 60% and the full-throttle jelly effect disappeared.
Case 3: 3D-Printed Micro-UAV — Low-Frequency Structural Vibration
-
Config: 3D-printed PETG frame (180mm wheelbase), 2204 2300KV motors, 5030 propellers, HAKRC F722 flight controller, Betaflight 4.5 firmware, 4S 850mAh battery.
-
Symptoms: Severe shaking immediately after takeoff; Betaflight blackbox logs showed abnormally high D-term spikes.
-
Log analysis: 3D-printed frames have much lower stiffness than carbon fiber — low-frequency structural vibration is a common problem. Logs showed a broad peak in the GYRO data at the 80-150 Hz band, which is PETG material deforming under motor RPM-induced structural vibration.
-
Solution: Two-pronged approach: (1) Physical reinforcement — added carbon fiber sheets at the arm-to-center-plate joints to increase stiffness; (2) Software filtering — set a static low-pass filter in Betaflight with a 200 Hz cutoff frequency, while reducing the D gain (D-term from 30 to 18). After adjustment, the low-frequency vibration peak disappeared and the D-term returned to normal.
5-Step Standard Log Analysis Workflow
Here’s a reusable log analysis workflow — applicable regardless of aircraft type:
-
Check GYRO standard deviation: Should be <3 rad/s during hover. If >5 rad/s, do physical vibration reduction first (propeller balancing, damping balls, frame reinforcement) — don’t rush to adjust PID.
-
Check PID output amplitude: P-value oscillation within ±0.1 is normal. If >±0.3, the controller is oscillating — reduce the P value.
-
Check throttle correlation: Vibration worsens with throttle — frame resonance, use dynamic notch filter. Vibration unrelated to throttle — sensor noise or P value too high.
-
Check spectrum analysis: Use FFT to analyze vibration frequency distribution. Peaks near propeller frequency (motor RPM/60 × number of blades) are normal propeller noise; non-propeller-frequency anomalous peaks require targeted treatment.
-
Compare before and after parameter changes: After each parameter adjustment, fly once and save the new log. Use APM Log Analyzer to compare GYRO standard deviation and PID output amplitude before and after. Improvement only validates the direction.
Log analysis is the most “boring but highest-value” skill in drone technology. Many pilots tune purely by feel and fly for half a year without knowing what their aircraft’s actual problem is. Learn to read logs and you’ll be more professional than 90% of pilots.
The three aircraft cases illustrate one principle: different aircraft types have different vibration characteristics — F450 demands P-value attention, MARK5 demands resonance treatment, 3D prints demand structural stiffness. But the analysis method is universal: check GYRO first, then PID, then throttle, then spectrum.
The PID and vibration analysis techniques in this article directly apply to every aircraft Aomway tests — from our FPV racing platforms to custom-built long-range rigs. When you fly an Aomway ground station and see vibration artifacts in your video feed, or notice altitude hold instability, the same 5-step workflow applies: GYRO → PID → CTUN throttle → spectrum → iterate. At Aomway, we review DataFlash and blackbox logs on every prototype before it ships, because the log doesn’t lie. Questions about PID tuning, vibration analysis, or our FPV and antenna solutions? Contact us at [email protected].
Frequently Asked Questions
1. My GYRO standard deviation is 4.5 rad/s during hover — should I immediately reduce PID P values?
No — not until you’ve ruled out physical causes. The 5-step workflow puts GYRO standard deviation first for a reason: if vibration is above 3 rad/s, the PID controller is compensating for physical problems it cannot solve by tuning. Start with physical vibration reduction: check propeller dynamic balance (prop balancers cost under $20), verify motor bearing condition, check for loose frame bolts, and inspect the flight controller’s damping mount. In most cases, correcting the physical vibration brings GYRO SD below 3 rad/s naturally, and then PID tuning has a clean baseline. Reducing P values while vibration is high only masks the symptom and can cause sluggish response.
2. How do I distinguish frame resonance from motor/propeller imbalance in the logs?
Frame resonance has two hallmarks in the logs: (1) it is strongly throttle-correlated — vibration amplitude increases sharply above a certain throttle threshold, as seen in the MARK5 case where SD jumped from 1.5 to 12 rad/s across the throttle range; (2) FFT spectrum shows a narrow peak at a specific frequency (often 200-500 Hz for carbon fiber frames), not at propeller frequency. Motor/propeller imbalance, by contrast, typically shows a broad peak near propeller frequency (RPM/60 × blade count), and the vibration is more constant across throttle levels. Dynamic notch filters are the solution for resonance; propeller balancing and motor inspection are the solution for imbalance.
3. Can I use this log analysis workflow for Betaflight logs as well?
Yes, with adaptations. Betaflight uses blackbox logs (. BFL) rather than DataFlash, analyzed in Betaflight’s Blackbox Explorer or flight analysis tools like Labs Blackbox Tools. The core concepts map directly: gyro data (similar to ATT), D-term traces (analogous to PID output), and motor output traces (similar to CTUN). The 5-step workflow — check raw gyro vibration, check D-term/P-term behavior, check throttle correlation, do FFT spectrum analysis, compare before/after changes — applies equally to Betaflight. One key difference: Betaflight’s D-term is the primary indicator of PID oscillation in most cases, whereas ArduPilot separates P/I/D more distinctly. For Betaflight specifically, start with D-term spikes in the blackbox graphs; they appear earlier and more clearly than P-term oscillation.
4. What’s the difference between ATC_RAT_RLL_P and traditional Rate P gain in PID tuning?
In ArduPilot’s architecture, ATC_RAT_RLL_P (Rate Roll P) is the P term of the inner-rate loop, which directly controls angular rate response. The ” ATC_RAT ” prefix means “Attitude Control — Rate.” ArduPilot uses cascaded PID loops: the outermost is the Attitude Controller (which produces desired rate targets from pilot stick input), and the inner loop is the Rate Controller (which drives motors to achieve those rate targets). ATC_RAT_RLL_P is the gain on that inner loop. Traditional single-loop rate P (like in Betaflight’s “Rate P”) does the same job but in one loop. ArduPilot’s cascaded architecture means that the rate loop parameters (ATC_RAT_xxx_P/I/D) are what you tune for vibration and oscillation issues — not the outer attitude loop parameters. When the MARK5 or 3D-printed micro-UAV cases above mention “reducing P values,” they refer to ATC_RAT_RLL_P and ATC_RAT_PIT_P.
5. How does a dynamic notch filter work, and when should I set it up manually vs. let INAV auto-tune it?
A dynamic notch filter tracks and attenuates a narrow frequency band that would otherwise cause resonance. In INAV, the Dynamic Notch has a center frequency that can auto-track the motor and structural resonance peaks detected in real time — this is the preferred method for most racing drones with variable flight characteristics. Set the filter’s detection range (e.g., 80-400 Hz) and let the EKF/sensor fusion identify the peak. Manual setup is needed when: (1) the resonance is structural and very stable (same frequency every flight), in which case a static notch at that frequency is more precise; (2) the dynamic notch’s detection algorithm is too slow and the resonance still causes problems before the filter adapts; (3) on resource-constrained boards where the dynamic algorithm adds CPU load. For the MARK5 case, INAV’s auto dynamic notch at 350 Hz with Q=250 eliminated the resonance entirely — this is the recommended starting point for any carbon fiber racer.
