

Your drone just crashed. What actually happened? Most people guess — but the flight controller log has the answer, written clearly. The flight log is the most authoritative source for fault diagnosis, yet many people open Mission Planner, see a wall of curves, and freeze.
Here’s the headline: flight log analysis is not as hard as it looks. Remember five key log types (ATT/CTUN/NTUN/PM/ERR), follow a 4-step method, and you can self-diagnose 80% of common failures.
1. What Is the DataFlash Log: The Flight Controller’s Black Box
What the log does
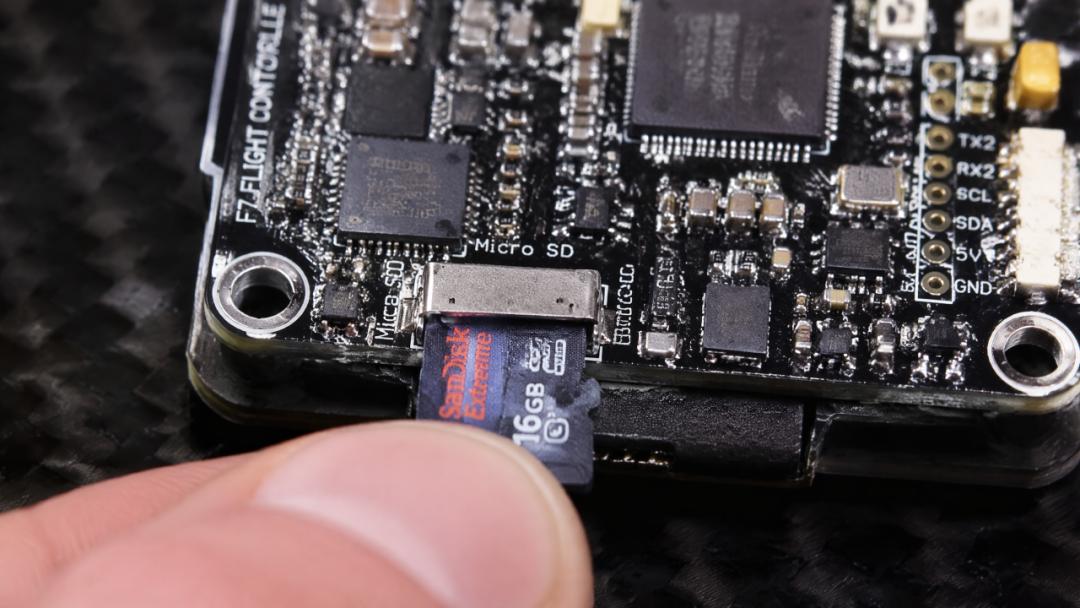
The DataFlash log is data automatically recorded by the Pixhawk 2.4.8 flight controller during flight, covering attitude, altitude, navigation, current, and sensor status. It’s the aircraft’s equivalent of a black box — the first thing to do after a crash is read the log.
Where logs are stored
Logs are stored on the flight controller’s onboard DataFlash chip, not on the SD card (note the difference from the log folder). With ArduPilot 4.6.x as an example, logs are automatically written to flash after each flight.
2. The Five Key Log Types: Know Them Before You Analyze
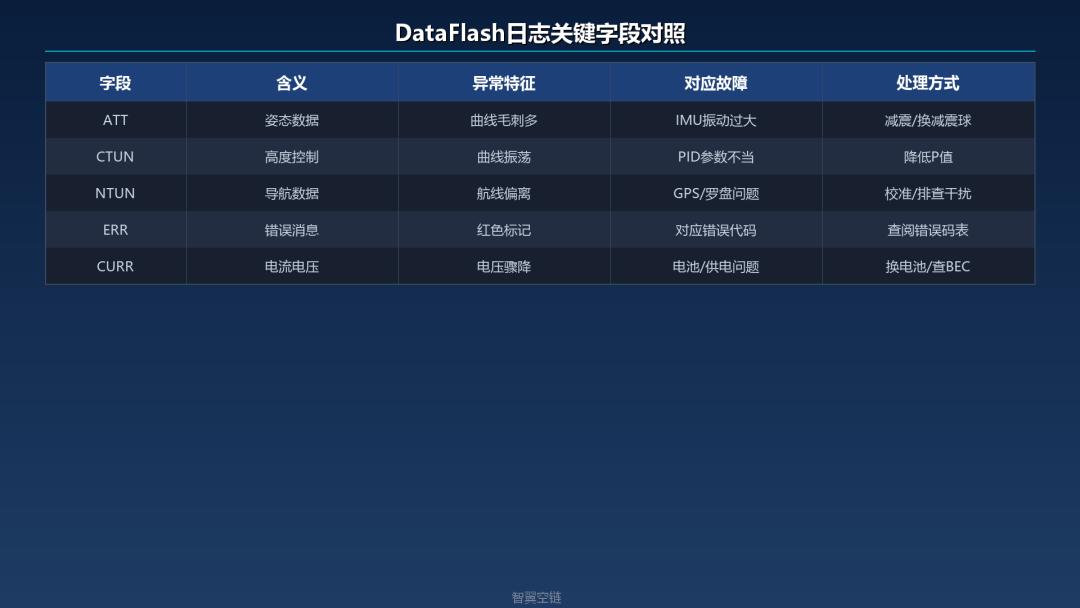
ATT (Attitude Log)
Records the aircraft’s pitch, roll, and yaw angles. This is the first data source for judging flight stability. In normal flight the curves are smooth; if you see dense spikes, it indicates excessive IMU vibration or inadequate flight controller damping.
CTUN (Altitude Control Log)
Records target altitude, actual altitude, barometer readings, and climb rate. In hover, the altitude curve should be a flat line; large fluctuations suggest the barometer is affected by airflow or the altitude controller parameters are poorly tuned.
NTUN (Navigation Log)
Records navigation data including GPS position, course deviation, and waypoint distance. In LOITER mode, if the aircraft circles and drifts, check WP_distance and Xtrack_error in NTUN to localize the problem.
PM (Process Monitor Log)
Records the flight controller main loop period and task execution times. If the PM log shows an abnormal task period, the flight controller is overloaded — possibly excessive sensor data volume or a firmware bug.
ERR (Error Log)
Records all error messages during flight, including hardware faults, sensor anomalies, and parameter limits. This is the entry point of log analysis — check ERR first to quickly identify errors.
3. The 4-Step Log Analysis Method: Follow in Order
Step 1: Download the Log
Two ways:
-
USB direct connection: connect the flight controller via USB, Mission Planner → Data Management → DataFlash logs → Download log
-
MAVLink wireless download: download remotely via telemetry radio — slower, but suitable when you can’t open the aircraft on site
Step 2: Open in Mission Planner
Mission Planner → Flight Data → Auto Analysis — run the automatic analysis first; it marks obvious anomalies. Then open the log browser manually and review entries one by one.
Step 3: Check ERR Messages to Locate Errors
Filter ERR messages in the log browser and review all error records chronologically. Common ERR types:
-
ERR: GPS: Glitch: GPS drift -
ERR: EKF: Variance: EKF variance exceeded -
ERR: Baro: variance: barometer anomaly -
ERR: Compass: variance: compass interference
Step 4: Analyze ATT and CTUN Curves to Find Anomalies
After locating the error time window, switch to the ATT and CTUN views and examine the attitude and altitude curves in that period to determine whether it’s a control problem or a sensor problem.
4. Log Signatures of Common Faults: Match Your Symptoms
Fault 1: Excessive IMU Vibration
Log signature: dense spikes in the ATT curve, high-frequency jitter in pitch and roll.
Cause: inadequate flight controller damping; motor vibration transmitted directly to the IMU.
Fix: check whether the damping foam has aged; consider adding a vibration isolation board. If vibration values AccX/AccY/AccZ exceed the -15 to +15 range, action is needed.
Fault 2: Compass Interference
Log signature: sudden jumps in the MAG (magnetic field) curve; clear deviation between compass readings and GPS heading.
Cause: ESCs, battery wires, or metal parts generate magnetic interference on the compass.
Fix: move the flight controller away from ESCs; check whether an external compass is more suitable. Run Compassmot calibration for interference compensation.
Fault 3: Sudden Voltage Drop
Log signature: the voltage curve in the CURR (current) log drops suddenly, accompanied by an ERR low-voltage alarm.
Cause: aged battery with increased internal resistance, or cold solder joints causing excessive voltage drop under high current.
Fix: measure battery internal resistance with a multimeter; consider replacement above 50 mΩ. Check solder joints for cold joints.
5. Advanced Log Analysis Tips
Make it a habit to review logs after every flight
Don’t wait for a crash to read the logs. Spend 2 minutes after each flight scanning the ERR messages — it catches hidden problems early and kills faults in the bud.
Use ArduPilot log analysis tools
Beyond Mission Planner’s built-in log browser, use ArduPilot’s official online log analyzer — upload the log and it automatically generates an analysis report, which is beginner-friendly.
At Aomway, we treat flight log analysis the same way — every aircraft we ship and every FPV platform we build gets its logs reviewed before and after testing, because the DataFlash record is where engineering discipline meets real-world performance. The five log types covered here map directly to the telemetry Aomway ground stations display: attitude stability, altitude hold, navigation accuracy, system load, and error events. When you’re flying long-range missions with an Aomway Commander ground station or troubleshooting an intermittent issue on a custom build, knowing how to read ATT, CTUN, NTUN, PM, and ERR will save you hours of guesswork. Have questions about flight logs, PX4/ArduPilot tuning, or our FPV and antenna solutions? Contact us at [email protected].
Frequently Asked Questions
1. Where exactly are DataFlash logs stored on the flight controller?
On ArduPilot systems (e.g., Pixhawk 2.4.8), DataFlash logs are stored on the onboard DataFlash flash chip, separate from the SD card. The SD card’s “log” folder serves a different purpose (typically mission planning data and some parameter/waypoint storage). On ArduPilot 4.6.x, logs are written to flash automatically after flight. To download: connect via USB and use Mission Planner → Data Management → DataFlash logs, or download wirelessly over MAVLink telemetry — slower but convenient when disassembly isn’t practical. The distinction matters because if you’re only checking the SD card, you might miss the crash log entirely.
2. What does “ERR: EKF: Variance” actually mean and how serious is it?
It means the Extended Kalman Filter’s estimated state variance exceeded its configured limits — the EKF no longer trusts its own estimates. This typically happens when sensor data is inconsistent (e.g., GPS glitches, barometer noise, or compass interference), causing the filter to diverge from reality. Severity depends on duration: brief variance spikes may be benign (momentary sensor dropout), but sustained variance usually precedes loss of position hold or unstable attitude, and can lead to flyaways in autonomous modes. Always correlate the ERR timestamp with ATT/CTUN curves to understand what the aircraft actually did during that window.
3. Can I analyze logs from PX4 drones the same way?
The workflow is similar but the tools and log format differ. PX4 uses ULog (stored in the log folder on the SD card), opened with tools like Flight Review (logs.px4.io) or QGroundControl. The key concepts map directly: attitude data, position/altitude control, navigation, and error/event messages exist in both ecosystems. ArduPilot’s DataFlash (ATT/CTUN/NTUN/PM/ERR) and PX4’s ULog both serve as black boxes, but you should use each ecosystem’s native analyzer. At Aomway we support both firmware families across our products and can help interpret logs from either.
4. How do I distinguish a sensor problem from a control problem in the logs?
The 4-step method is designed for this. Step 3 (ERR messages) tells you which subsystem complained — sensor errors (GPS glitch, baro variance, compass variance) point to sensors. Step 4 (ATT + CTUN curves) tells you the behavior: if attitude curves show high-frequency jitter with no sensor error, suspect mechanical vibration or IMU damping; if altitude oscillates slowly with smooth ATT, suspect barometer disturbance or poorly tuned altitude PID. A useful rule: sensor problems usually appear first in ERR/raw sensor data; control problems show up as poor tracking of the command (actual vs target curves diverging) with healthy sensors.
5. What are the most common causes of sudden voltage drops in flight?
Three dominant causes: (1) aged batteries — internal resistance rises with cycles, so voltage sags under load; measure with a multimeter and consider replacement above ~50 mΩ per cell; (2) cold solder joints or undersized connectors — high current (especially on heavy multirotors, 30-60A+) creates resistive losses at bad joints; inspect and re-solder; (3) ESC or power module degradation — a failing ESC can draw irregular current. The log signature is a sudden CURR voltage drop with an ERR low-voltage alarm, often followed by attitude instability or brownout-induced failsafe. Check the battery voltage curve both at the start (under load) and during throttle spikes to distinguish sag from sustained drop.
